[Please read part 1 here.]
TL;DR: for JDK 1.5, watch your Full GC frequency with sun.rmi.dgc.server.gcInterval/sun.rmi.dgc.client.gcInterval
Read on for more.
Logging basic GC activity revealed very odd behavior:
1. Extended full garbage collection every evening at 10 pm.
Looking through the logs I would reliably find a large spike in the duration of one full garbage collection cycle at the exact same hour. I still cannot ascertain the cause of this - I searched extensively and found nothing. I even went to #oracle @ freenode but got no answer. One thing I did notice while going back through the opmn.log: ping timeouts almost always occurred at this time, and, indeed, there was at least one instance when OPMN bounced the server at this hour.
2. Full garbage collection approximately every ~64 seconds.
This one was interesting.
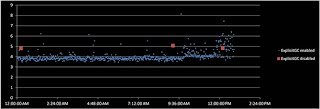
The Full GCs ran like clockwork instead of as a response to the server's load:
At first it struck me as odd that the average interval between Full GCs would be 64 seconds as opposed to 60. Looking back now the answer is obvious. More on that later.
Memory usage was forcefully kept in check by the constant battering of the garbage collector but at the cost of processing time available to do actual work: the JVM was losing 7.53% of its time to garbage collection. Breaking this down further:
| Young GC | Full GC |
Avg mem. usage post gc (MB) | 592 | 539 |
Total memory freed (%) | 98.5 | 1.5 |
GC time spent (%) | 3.6 | 96.4 |
The numbers are clear: these Full GC cycles are not being effective at all - in fact, they look outright useless and are robbing our server of precious processing time to do actual work!
So what could be triggering constant full garbage collection? This puzzled me for a while.
I went through all the parameters being passed to the JVM at startup: nothing. I felt confident about this finding yet I decided to put a final nail in the coffin and set the -XX:+DisableExplicitGC flag. This would also allow me to confirm if there exists some code somewhere in the JVM's classpath calling the System.gc() function. The results were striking:
How much server uptime was lost to garbage collection now? 0.19%. Looking good.
Of course, average memory usage and allocation increased - as expected - and the JVM's natural garbage collection algorithm reliably kicked in and freed enough memory.
Who was calling System.gc() ?
Good question.
First order of business was to review our source code. System.gc() was nowhere to be found. Next - check all dependencies explicitly declared for our projects. Decompiling them all and searching revealed 5 classes: 2 were Oracle's (weblogic, orabpel) and the other was related to Mozilla's javascript engine. A very brief attempt at figuring out all the possible paths that can lead this code to call System.gc() was very quickly aborted: this is a very difficult task, and I would be leaving out the countless other classes in the JVM's classpath.
I decided to dive into Oracle's KB to see what I can find. Answer: not much. Apparently, no one else was having this issue, or not many people have noticed it yet. I found quite a few articles detailing JVM troubleshooting methods, SOA Suite installation guides, etc., etc. - nothing of much use. Then, in passing, as a final note in an article liked to by another, I found mention of these uncommonly used startup parameters:
· sun.rmi.dgc.server.gcInterval
· sun.rmi.dgc.client.gcInterval
You can read more about them here. The default time of 1 hour mentioned there was not always the case - it used to be 1 minute. Our JDK was affected.
The difference between those default 60 seconds and the ~64 seconds on average from the first graph above were enough to bug me - until I looked at the second graph again: the average duration of each Full GC hovered close to 4 seconds. 60 + ~4 ~= 64. :D
Removing the -XX:+DisableExplicitGC flag and adding these two above, set to 1 hour each, proved fruitful: Full GCs were mostly limited to that hourly schedule.
Now it's just a question of figuring out the best values for our needs (or whether we need these settings at all).


