
Developing the WLST script proved a bit challenging only for the fact that all documentation of what constitutes "total pending messages" in the queue is a bit ambiguous (Oracle Weblogic's own documentation being the worst of all). So I did a little digging around and some experimenting and present to you here a graph which I think illustrates quite succinctly what it's all about:
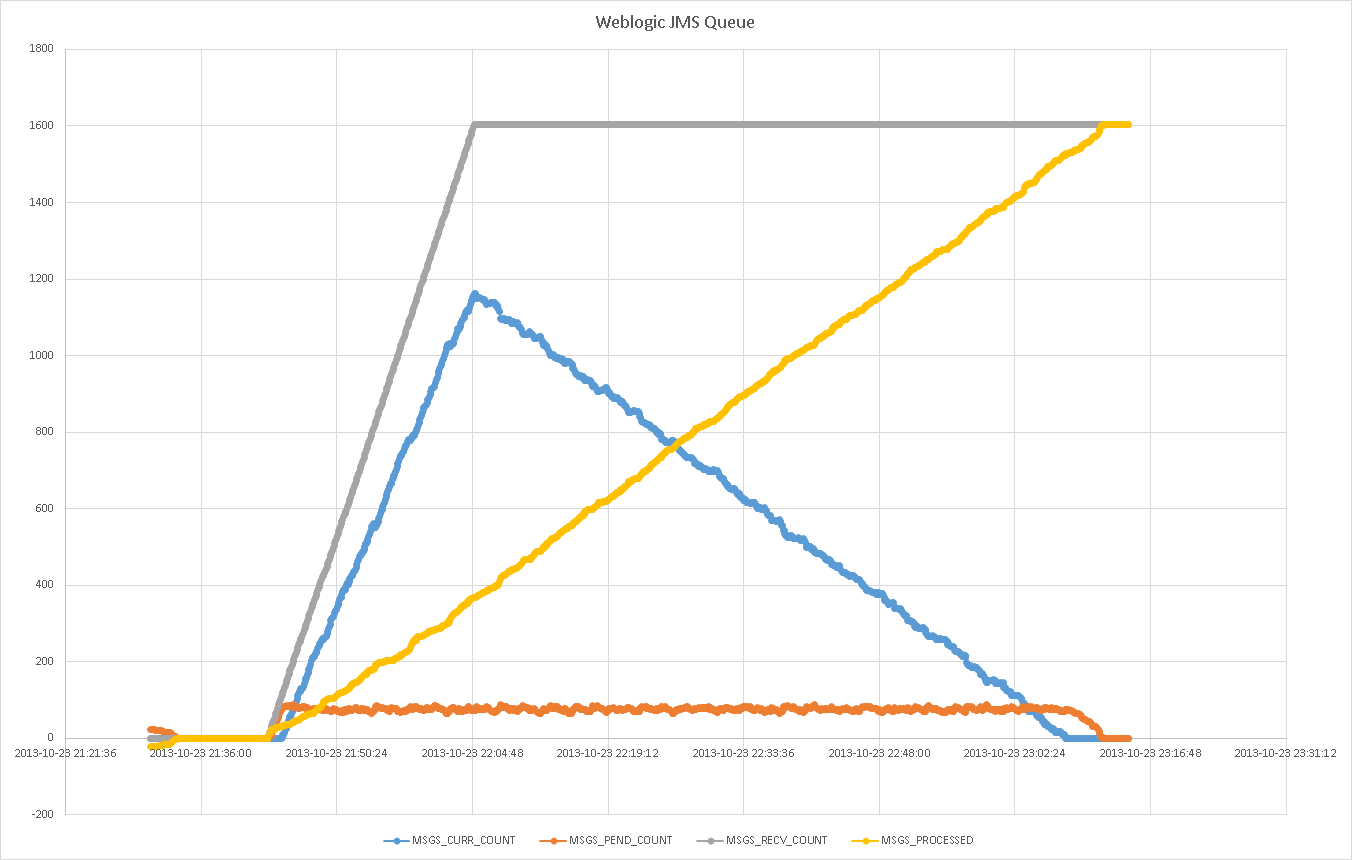
"Messages pending" seem to be the working buffer (tier 1) from where the MDBs consume the messages. "Messages current" seem to be a secondary buffer (tier 2, probably serialized to disk) which are fed into "messages pending" whenever there's available capacity in the latter.
For proof, notice how "messages current" starts climbing only after "messages pending" has reached a certain level, and notice how "messages current" is the first to drop to zero, after which "messages pending" falls to zero as well.
By the way, "messages processed" in the graph was calculated using the simple formula: msgs_received - (msgs_current + msgs_pending).